Revenue Analytics
Track revenue performance and financial metrics in your operational dashboard.
Why this matters
- Provides visibility into business performance
- Helps identify revenue trends and patterns
- Supports operational planning and inventory decisions
- Enables tracking of fulfillment efficiency
Revenue report
The Revenue report tracks total revenue, profit, and margin at the order level. Merchants can filter by date range, currency, order status, order type, payment method, and country, and export results to Excel for deeper analysis. Revenue reports are operational analytics — they reflect order values and activity, not final accounting records.
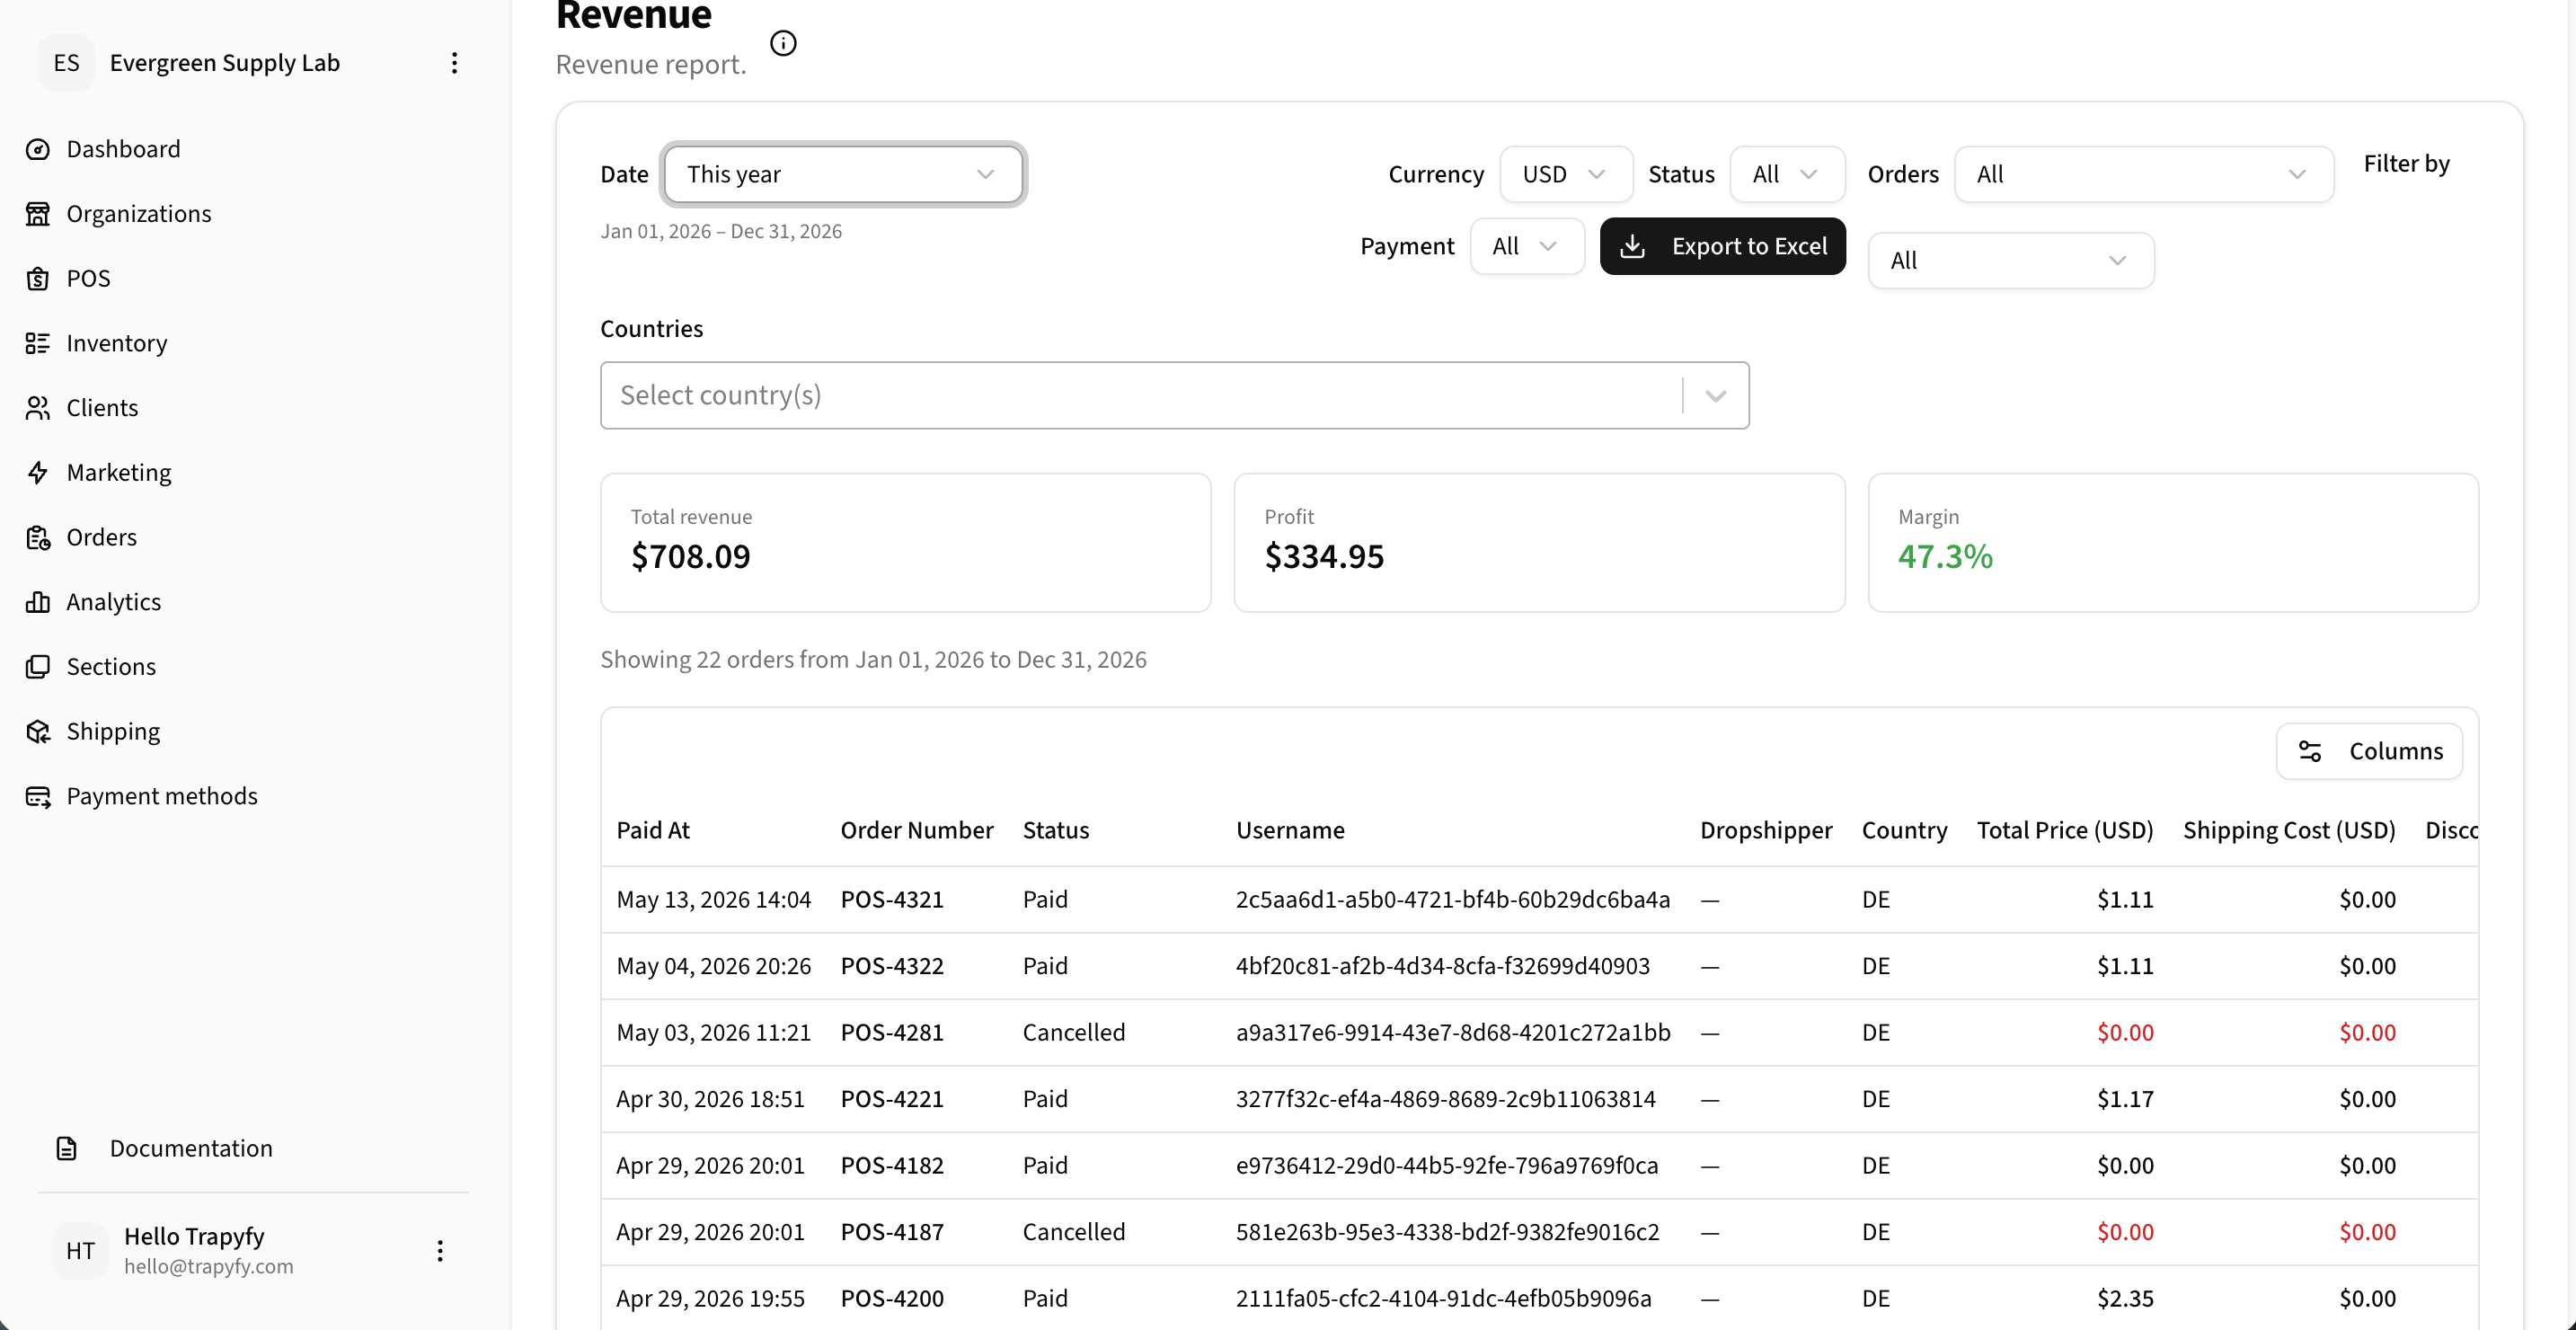
Use the Revenue report to review revenue, profit, margin, order-level details, filters, and exportable financial data.
Key metrics
- Total revenue
- Profit
- Margin
Filters
- Date range
- Currency
- Order status, type, payment method
- Country
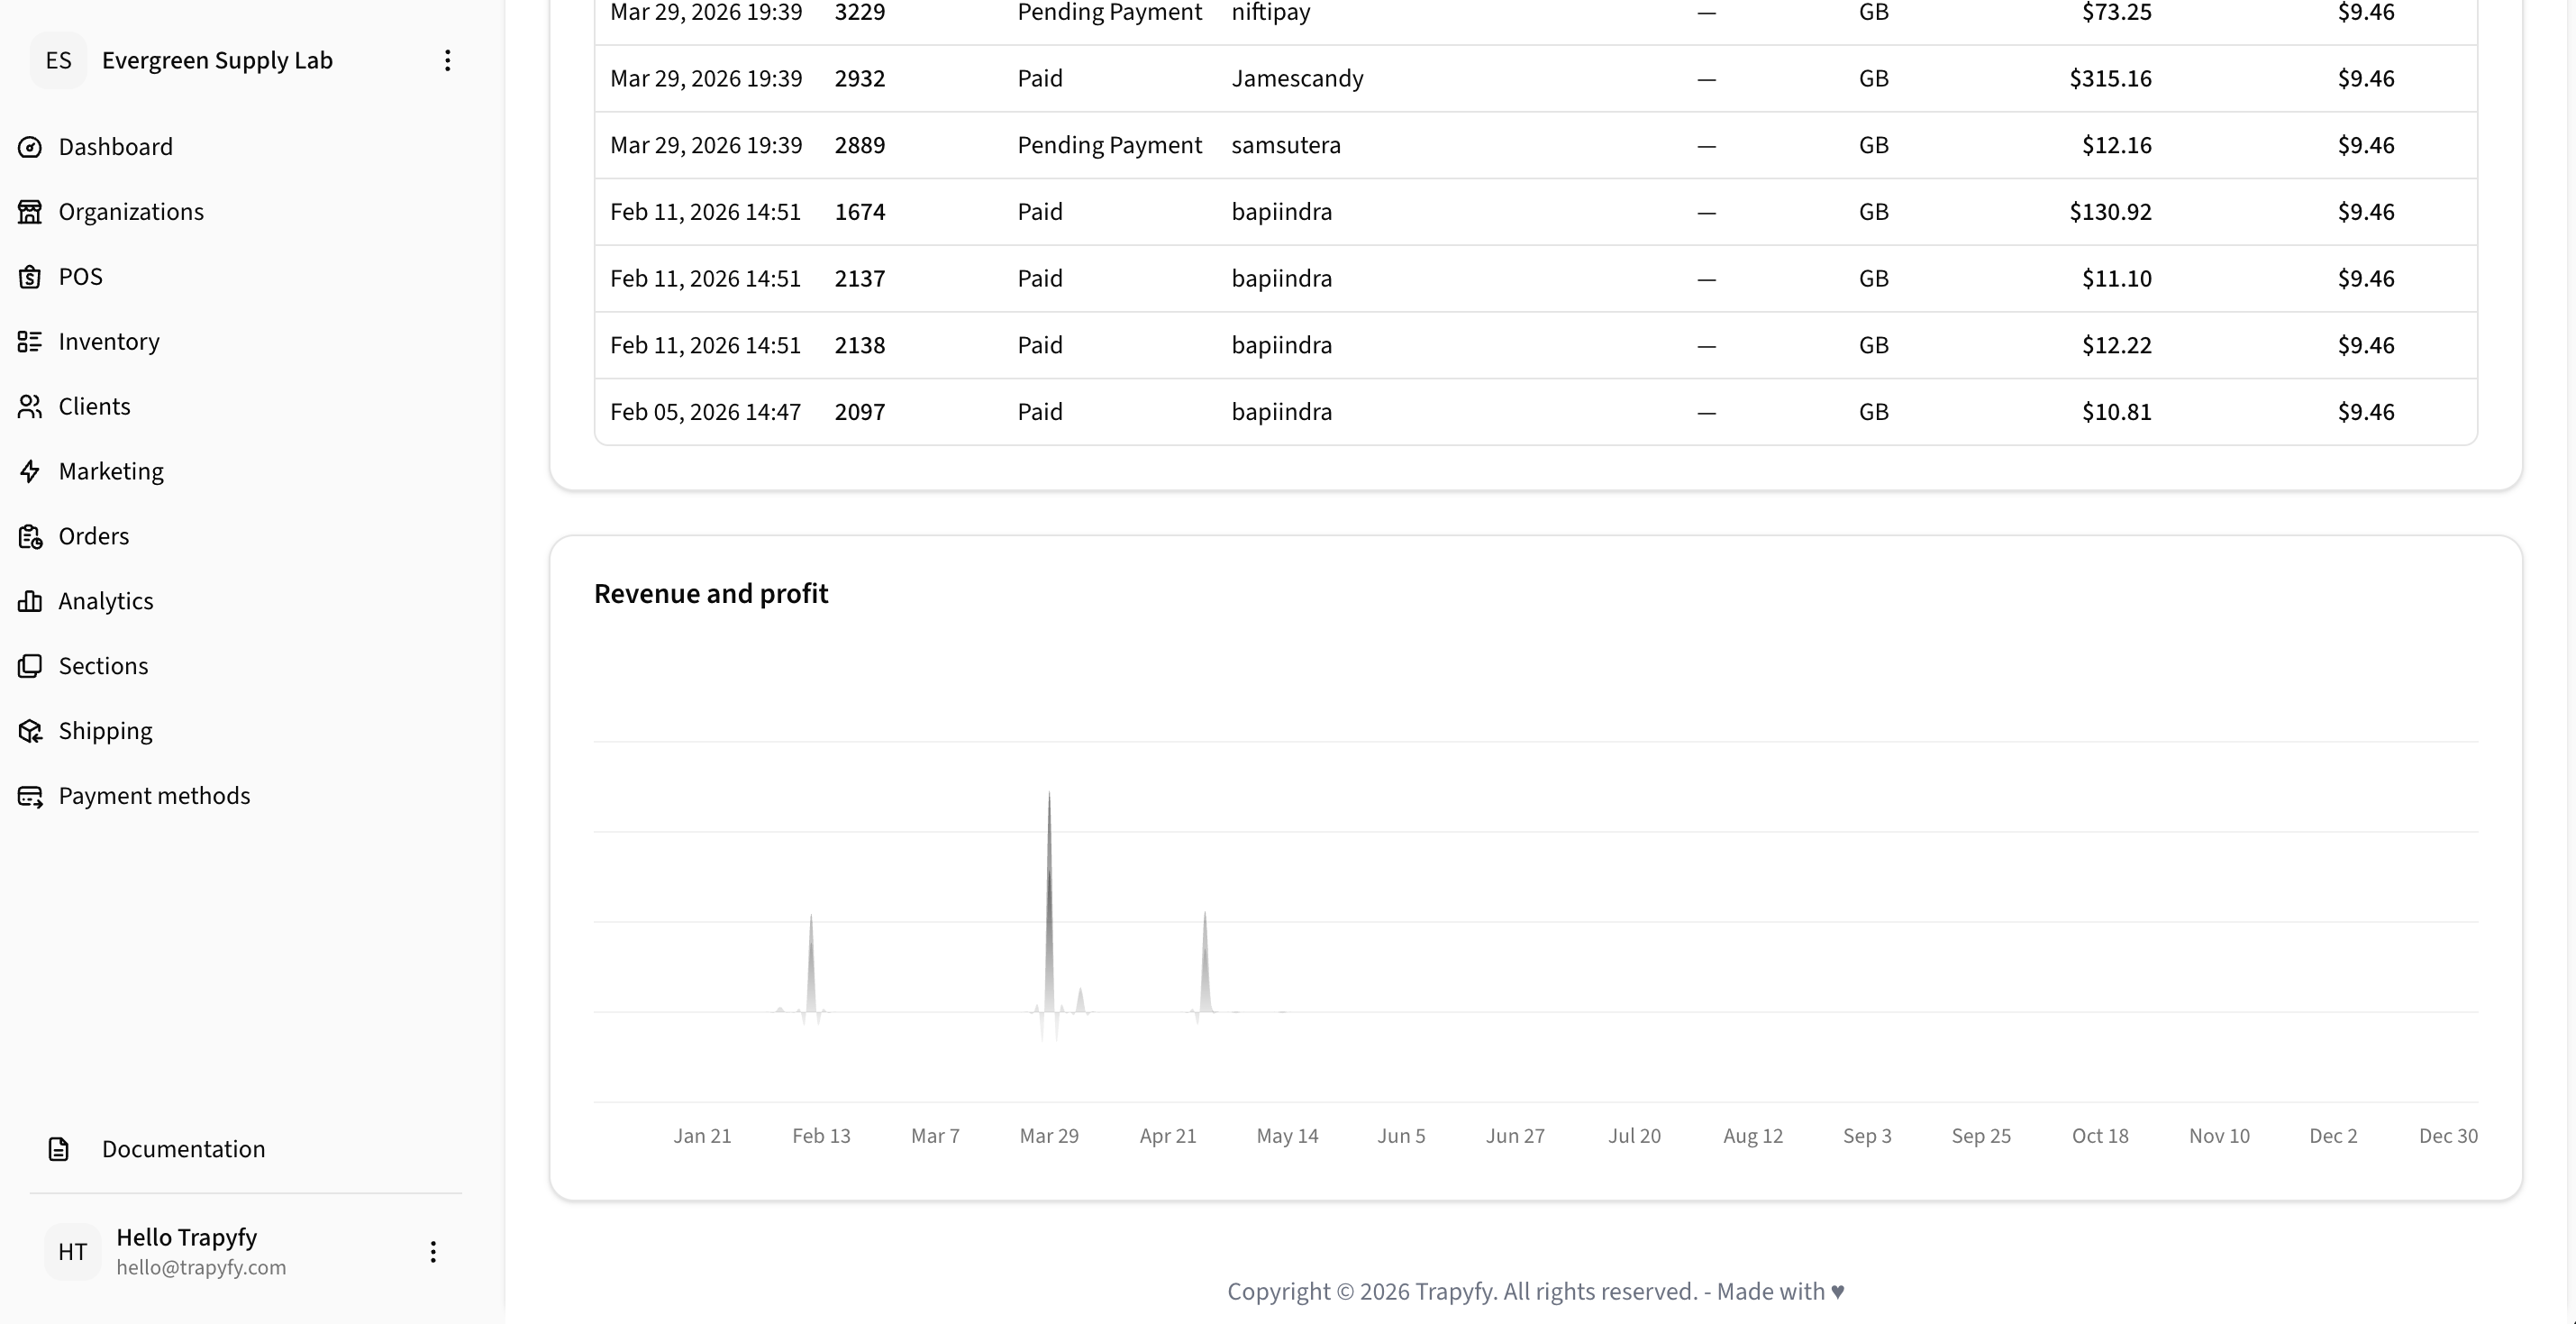
Revenue and profit charts help merchants understand performance trends over a selected period.
Category revenue
Category Revenue shows revenue, cost, and profit broken down by product category. Merchants can filter by date range and currency, and export the data to Excel. Category reporting helps identify which categories contribute most to sales and margin, supporting merchandising and category planning decisions.
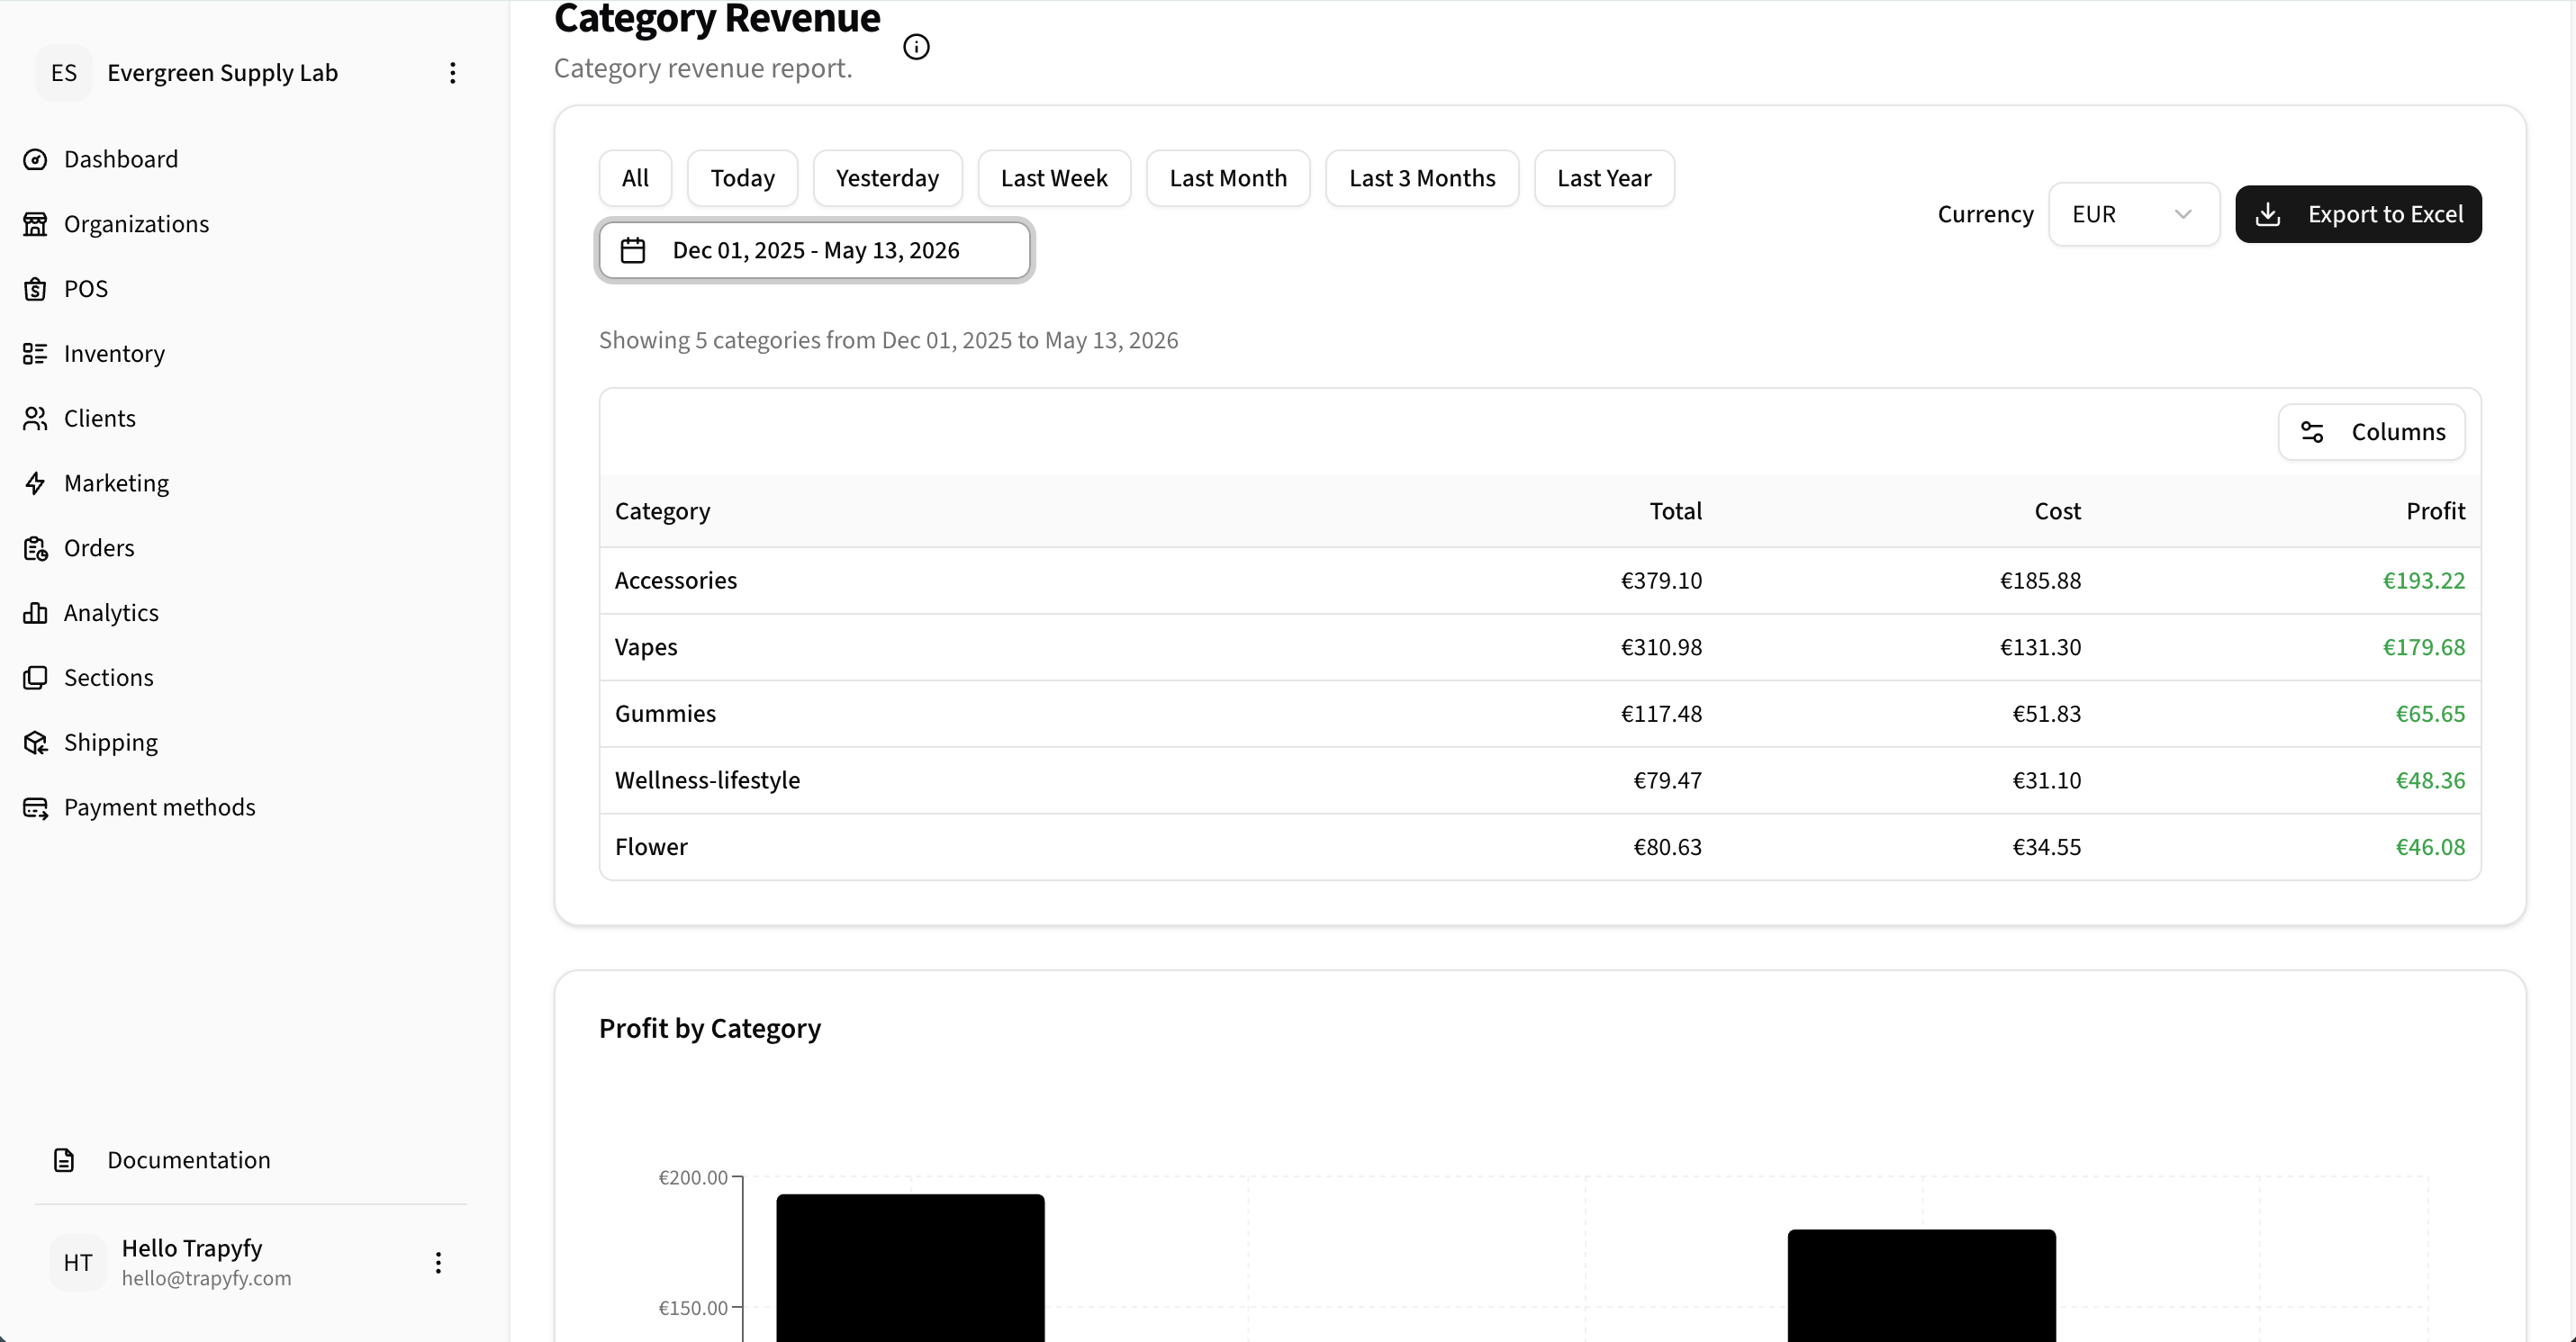
Use Category Revenue to compare revenue, cost, and profit across product categories.
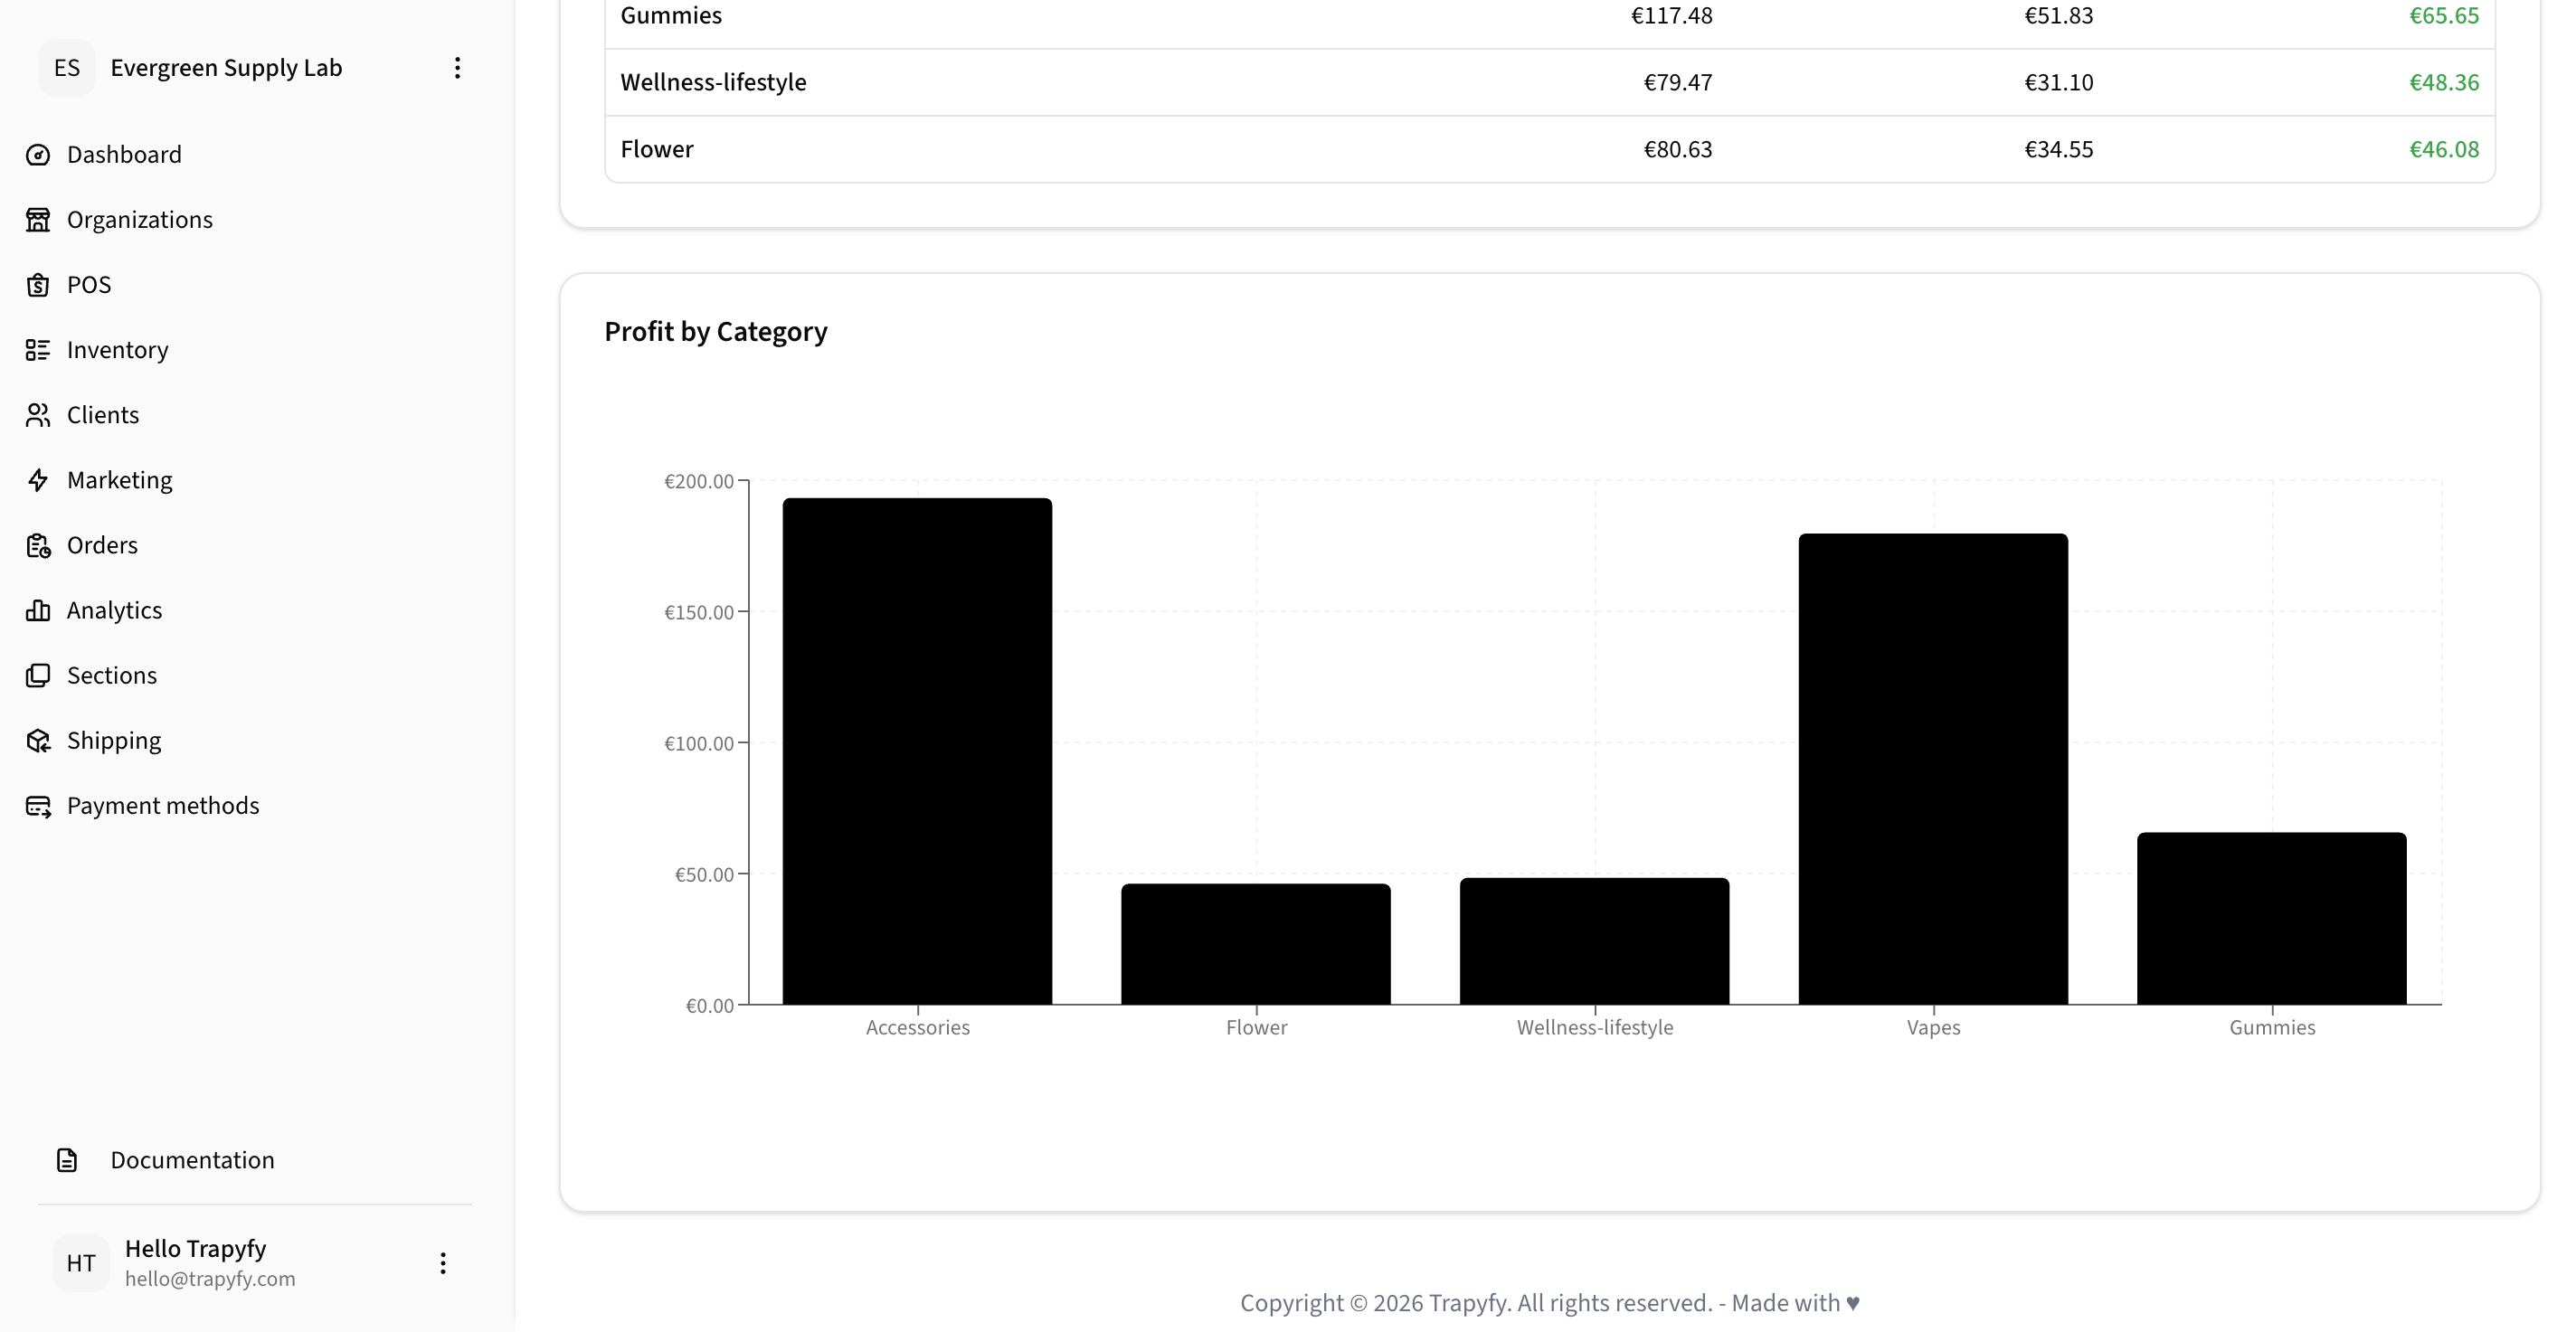
Profit by Category helps merchants compare which product categories are generating the strongest contribution.
Coupon performance
The Coupon Performance report shows coupon code redemptions, percentage of orders using coupons, total discount given, revenue after discount, and average order value. Merchants should compare redemptions, discount amounts, and revenue after discount to evaluate whether promotions are driving sales effectively.
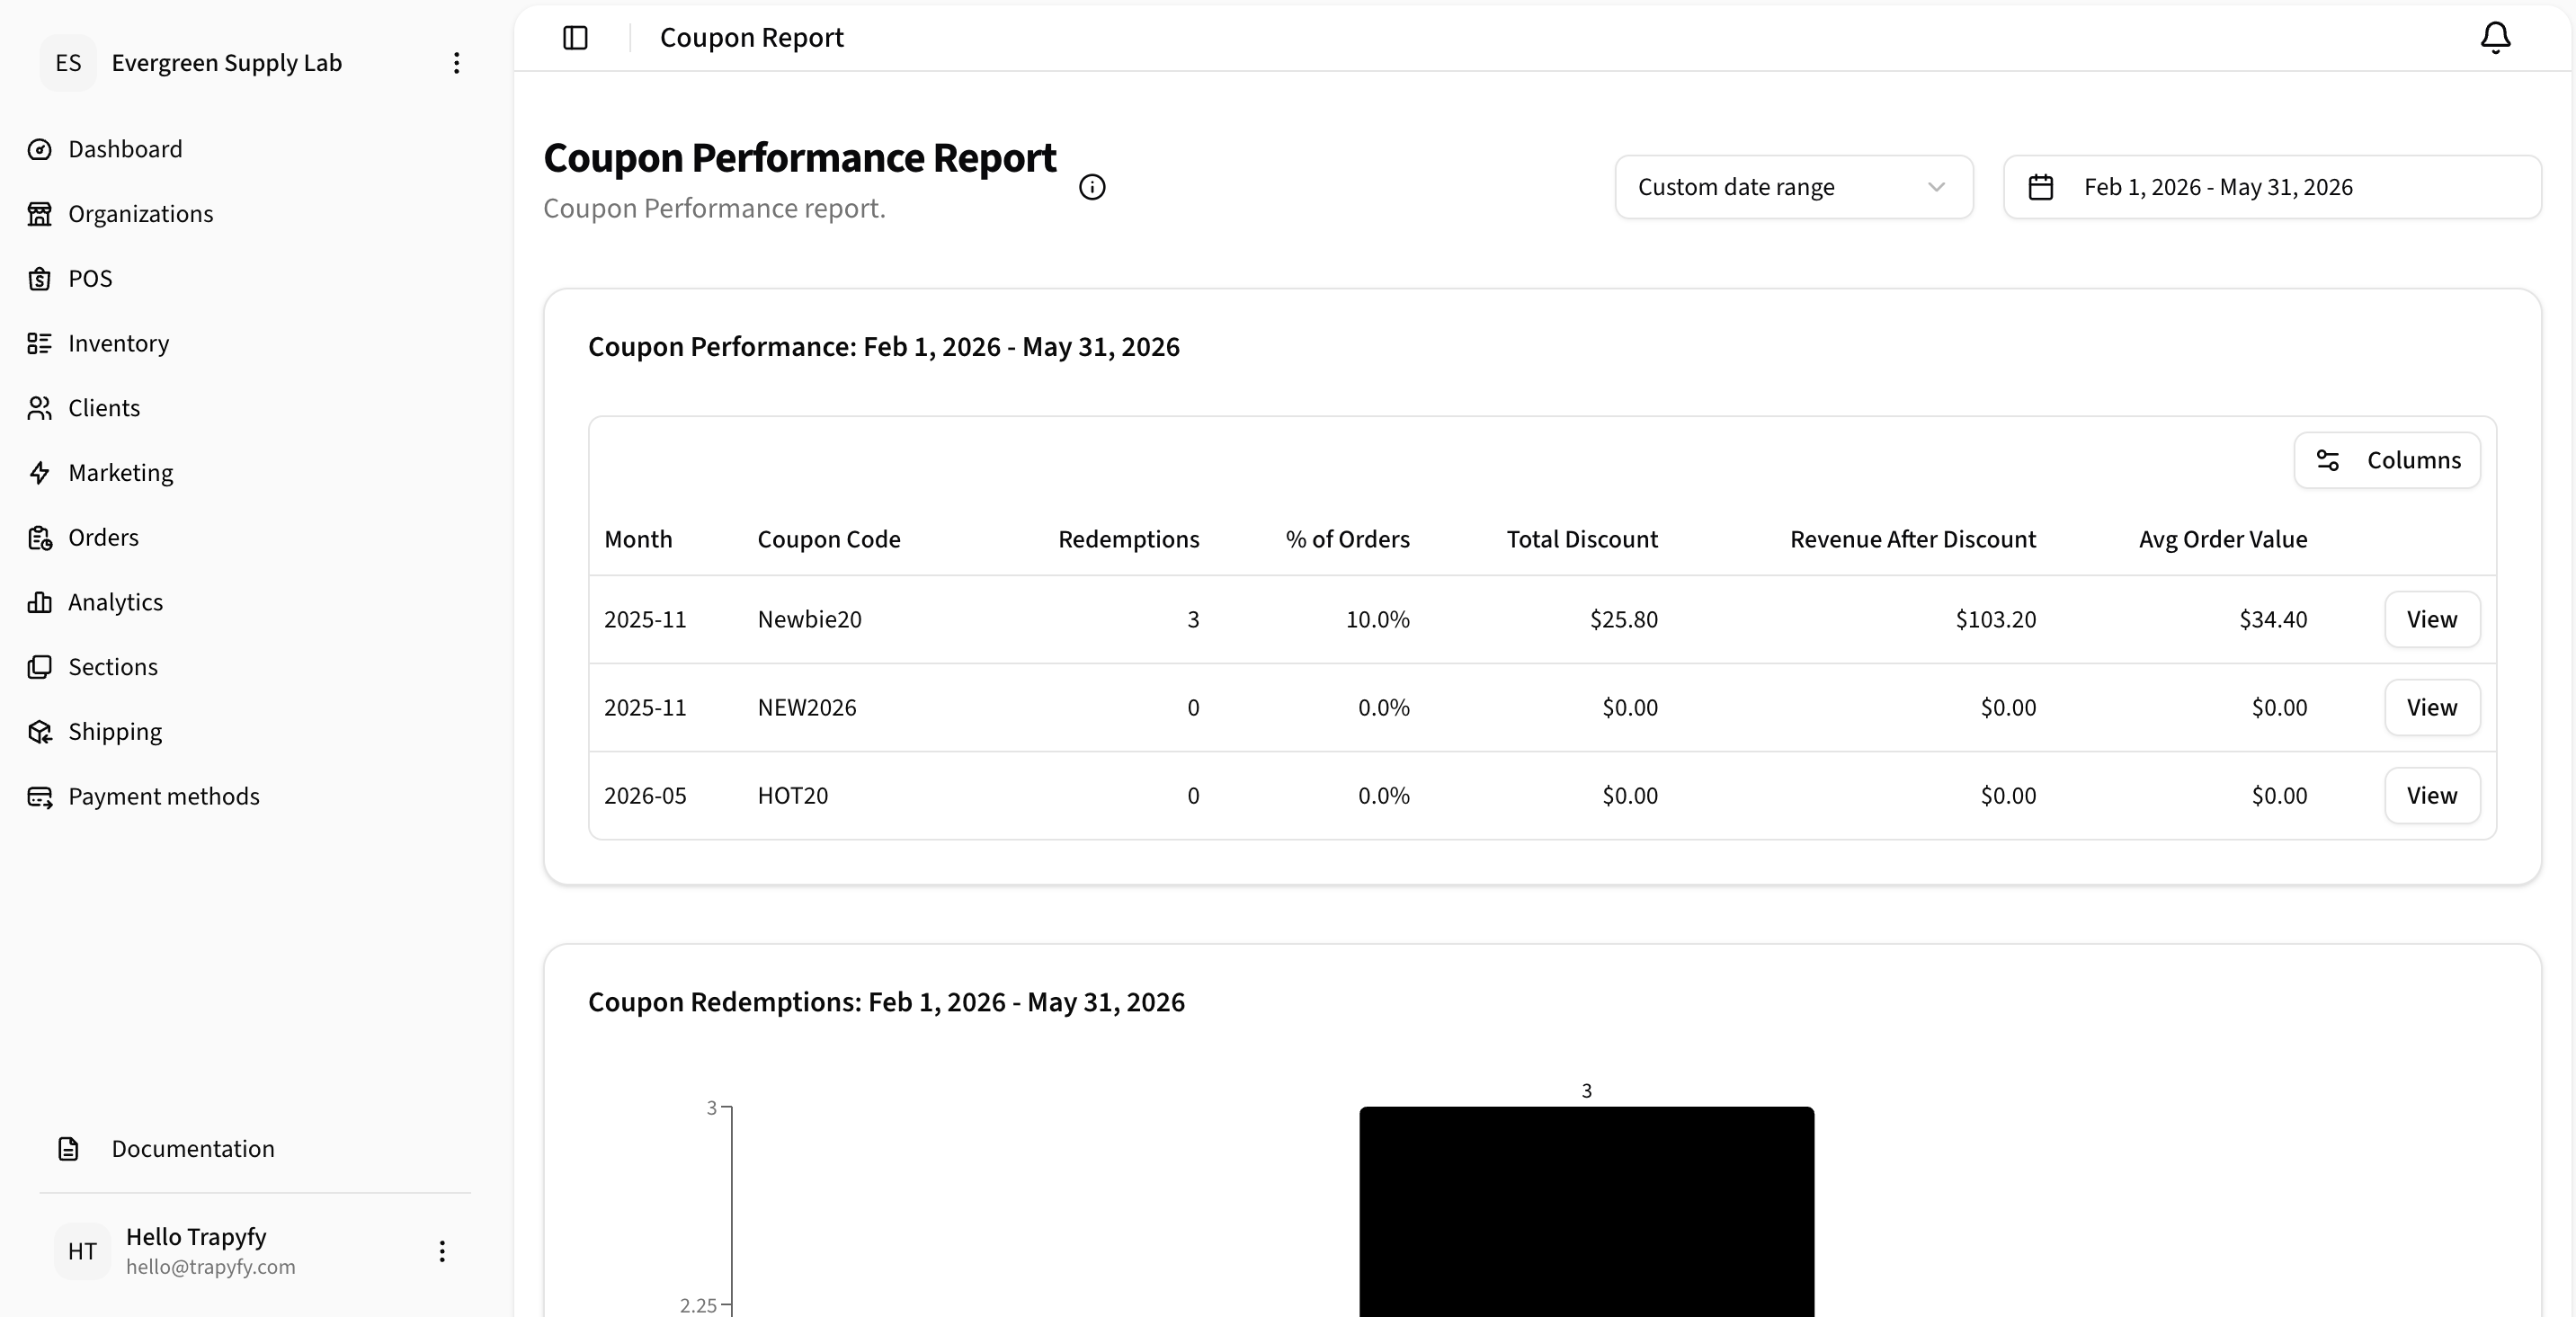
Use Coupon Performance to evaluate coupon redemptions, discount impact, revenue after discount, and average order value.
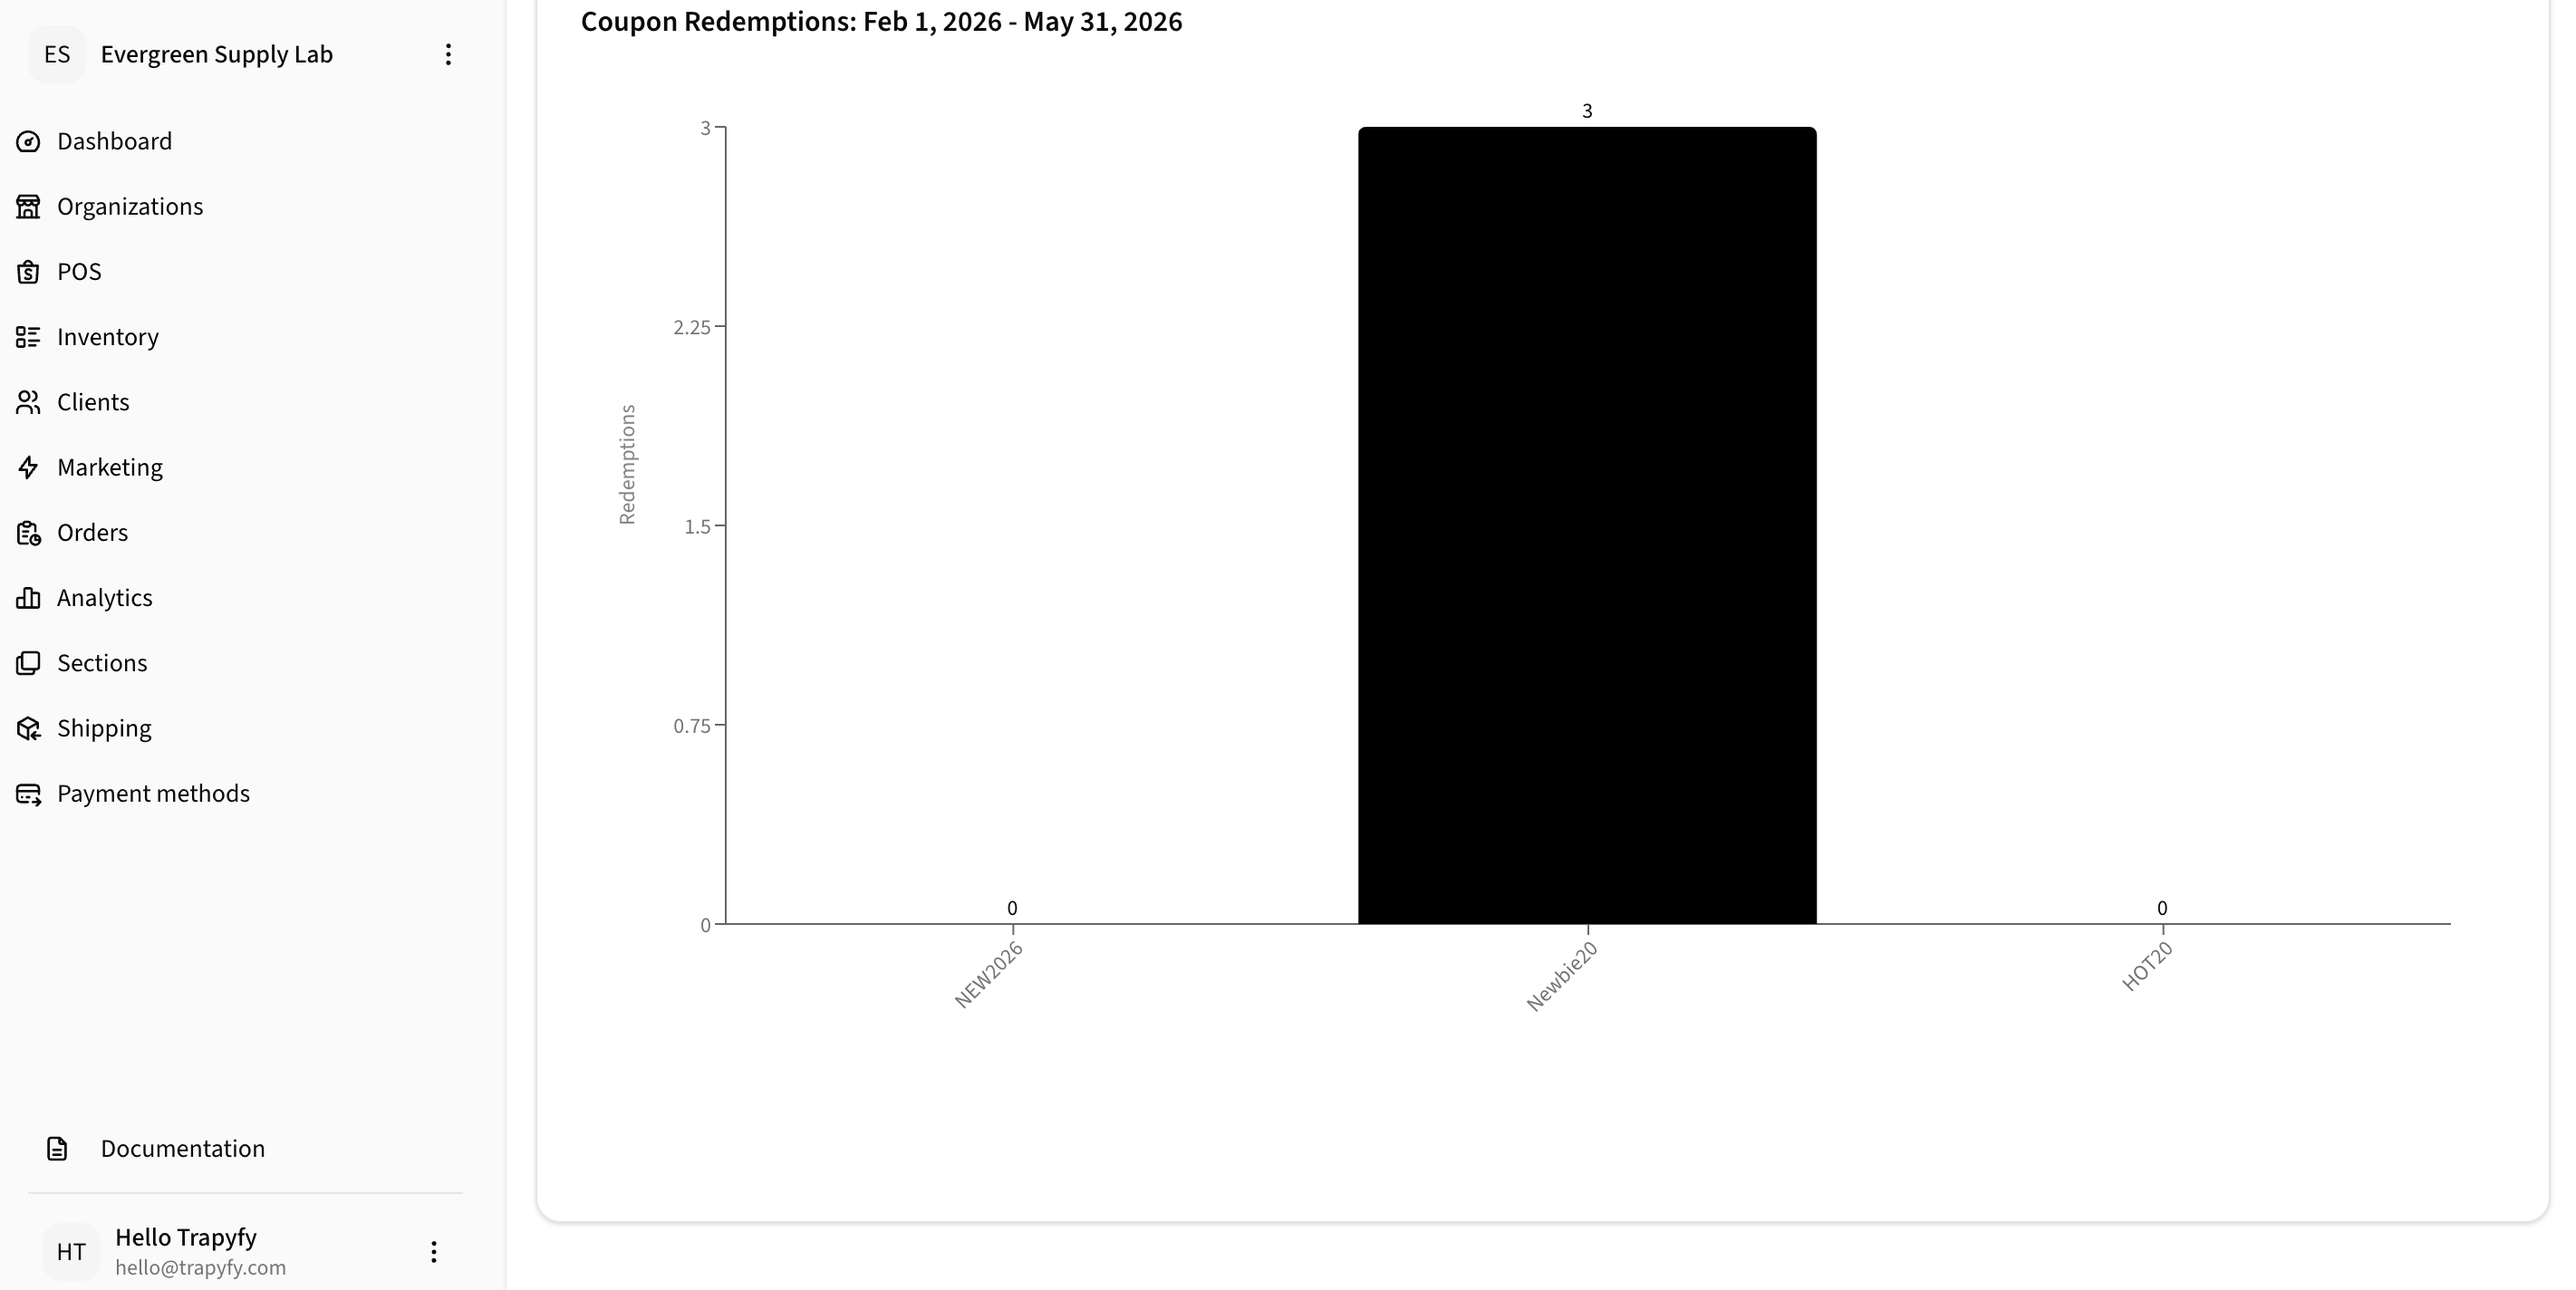
Coupon redemption charts help merchants compare promotion usage across coupon codes and identify underperforming promotions.
Supplier tracking
For merchants using dropshipping and shared products, the Analytics section tracks supplier payables, reseller margin, and transfer costs. Payables are calculated from transfer costs — not retail prices. Use these reports to manage payment obligations and reconcile outstanding supplier balances.
- Supplier payables — total owed to suppliers based on completed and pending supplier orders
- Reseller margin — retail price minus transfer cost per transaction
- Transfer cost reporting — review per-product, per-country wholesale costs
Revenue data in Trapyfy reflects order values. For payment settlement and payout details, refer to your Niftipay dashboard.
Export capabilities
Most analytics reports include "Export to Excel" functionality for deeper analysis, accounting, or sharing with stakeholders.